From Guessing Game to Reliable Business Intelligence
High employee adoption isn't just a vanity metric—it's the key to unlocking the true potential of your BI tools. When employees actually want to use the system, you get complete, accurate data that transforms your reporting from a guessing game into a reliable engine for strategic decision-making.
High employee adoption isn't just a vanity metric—it's the key to unlocking the true potential of your BI tools. When employees actually want to use the system, you get complete, accurate data that transforms your reporting from a guessing game into a reliable engine for strategic decision-making.
The Problem with Traditional BI Tools
Powerful BI tools are crippled by one persistent problem: inconsistent time tracking. When employees find logging hours tedious, they do it infrequently or inaccurately. Record'em solves this by focusing on the human side of time entry.
Why Traditional BI Tools Fail:
- Inconsistent Data: When employees find logging hours tedious, they do it infrequently or inaccurately.
- Poor User Experience: Cumbersome forms and complex interfaces create friction and resistance.
- Low Adoption: Employees resist using systems that feel like surveillance.
- Unreliable Insights: Poor data quality leads to unreliable business intelligence.
Record'em's Solution: Focus on the Human Side
Record'em solves this by focusing on the human side of time entry. Our approach drives unprecedented user adoption because employees actually want to use the system.
Key Features:
- Natural Language Processing: Users describe their activity in plain language—"Worked on the Q3 marketing report"—and our AI engine instantly structures and categorizes the entry.
- Calendar Integration: Record'em integrates with Outlook to turn an employee's schedule into a pre-populated timesheet.
- Teams Integration: Why force users into another app? Record'em lives inside Microsoft Teams.
- Effortless Interface: It's as easy as sending a message, making time tracking feel natural and conversational.
- Workflow Integration: Time tracking disappears into your natural workflow instead of interrupting it.
Benefits of High User Adoption
When employees actually want to use the system, you get complete, accurate data that transforms your reporting from a guessing game into a reliable engine for strategic decision-making.
Key Benefits:
- Improved Data Quality: Complete, accurate data from employees who actually want to use the system.
- Integrated Reporting: Seamless integration with existing BI tools and reporting systems.
- Reduced Overhead: Eliminate manual entry and administrative burden with automated time tracking.
- Employee Satisfaction: Time tracking disappears into your natural workflow instead of interrupting it.
- Increased Compliance: This approach drives unprecedented compliance rates because employees actually want to use the system.
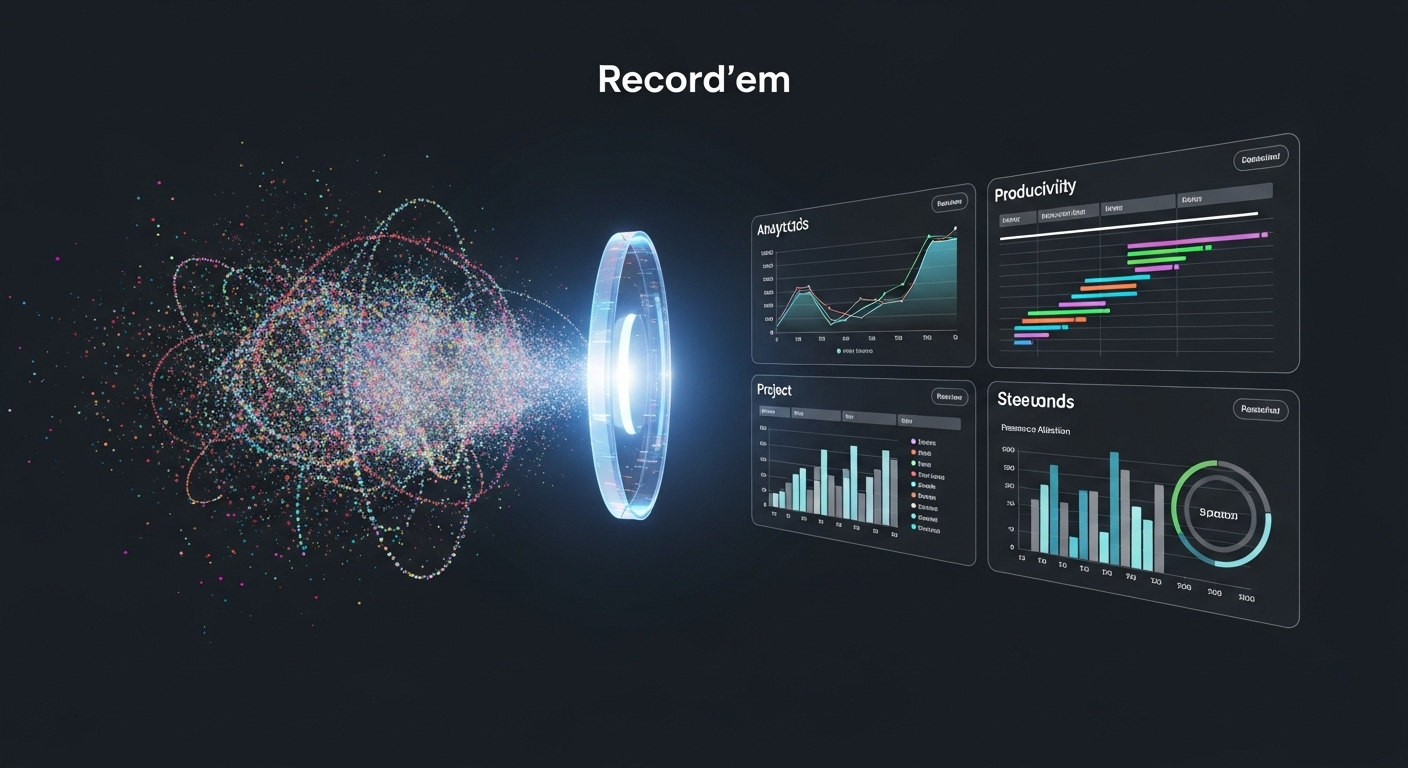
Transforming Your Business Intelligence
High employee adoption isn't just a vanity metric—it's the key to unlocking the true potential of your BI tools. When employees actually want to use the system, you get complete, accurate data that transforms your reporting from a guessing game into a reliable engine for strategic decision-making.
Strategic Decision-Making:
- Reliable Data: Complete, accurate data enables better decision-making and resource allocation.
- Real-time Insights: Up-to-date information for immediate strategic adjustments.
- Predictive Analytics: Historical data enables forecasting and trend analysis.
- Resource Optimization: Better understanding of time allocation and productivity patterns.
Conclusion
High employee adoption isn't just a vanity metric—it's the key to unlocking the true potential of your BI tools. When employees actually want to use the system, you get complete, accurate data that transforms your reporting from a guessing game into a reliable engine for strategic decision-making.
Ready to experience effortless time tracking?
Join thousands of users who trust Record'em for time tracking that works with people—not against them.
Try Record'em Free